Skip to content

Absorption Spectral Analysis at Gemstones

5/5

TOKL #T21001

Table of Contents

Abstract

This measurement report presents results of absorption spectral analysis at colored gemstones according to the classification of hardness [1]. Characteristic absorptions versus wavelength are measured within the visible spectral range about 400 nm to 750 nm using an SMA-E Spectrometer and optical fiber from Thunder Optics [2]. The measured spectral data are presented in spectral absorption diagrams and furthermore in spectral color bars. Both of them are computed with the software Spectragryph [3]. In the following sections the motivation of the work, the measurement set up, the illumination and light lunching in gemstones are described. At the end of the explanatory sections a conclusion and an outlook for a further work is given. The experimental achieved results are grouped according to the type of gemstone and tabular placed in the appendix. They will be supplemented and edited over time.

Introduction

Gemology laboratories and institutions invest a lot of money for equipment to analyze natural, synthetic, stacked and treated gemstones. From interest is the experimental proof of all physical, optical, mineralogical and chemical characteristics of gemstones. Hobbyists have typically a low budget and can’t invest so much money for analysis equipment.

In the last few decades more development power was spent in micro optical and optoelectronic systems. Therefore it was possible that more miniature USB diode array spectrometer comes into the marked. But most of inexpensive USB mini spectrometers can’t offer a good spectral resolution which is important for gemstone or mineral analysis. They often designed for quick and raw spectral resolution for industry applications of color or material analysis. For such applications a low resolution of app. 10 nm in the range of visible (VIS) and/or near infrared (NIR) wavelength spectrum is enough. But absorption spectroscopy at gemstones and mineral crystals needs higher resolution which should be app. 10 times better.

To overcome this problem Thunder Optics comes into the market with an SMA-E Spectrometer with higher performance. The technical specifications especially for detector sensitivity and spectral resolution are improved. In addition also quality and price have a good relationship. That is the fundamental basic and motivation to invest in an SMA-E Spectrometer from Thunder Optics. Such spectrometers offer the possibility for hobbyists, students, and smaller labs to start the spectral analysis.

Measurement Set Up

The measurement set up in Fig. 1 used for this work contains a wide band white light source, a spectrometer, an object holder and a netbook with analysis software to compute and illustrate the measured spectral data.


The illumination lamp is a KL1500 from Schott. It contains a Halogen lamp type Xenophot HLX 64 634 EFR 15 V 150 W from Osram with an integrated back side mirror reflector. An additional optical element in the lamp system is a heat absorption filter glass followed by a condenser lens.

The lamp light is couplet to a glass fiber bundle of app. 9 mm diameter with polished flat end facet. The fiber bundle is after short distance splitted in two separate glass fiber bundles of 4.5 mm diameter respectively. The typical spectral curve vs. wavelength of the Halogen lamp light is shown in Fig. 2.

Fig. 2. Spectral intensity line plot of a white light Halogen lamp

Osram Xenophot HLX 64 634 EFR 15 V 150 W;

The lamp shows a continuous wide band intensity power over the VIS range from 400 to 700 nm.

Fig. 3. Spectral intensity line plot of a LED

Compared with the intensity distribution in the plot of Fig. 2 the LED has less power between 475 to 700.

Spectral diagram & color bar processed by Spectragryph [Ref. 3]

The used spectrometer device is the SMA-E Spectrometer from Thunder Optics. It is calibrated for a VIS-NIR spectral range from 380 nm to 930 nm. The slit width is 100 µm and matched to a multimode fiber of type MMF 100/125 µm core/cladding diameter. The fiber patch cable comes with standard SMA connectors SMA905 on both ends. The length of the fiber cable is about half meter. The free end of the fiber is orientated to the measured gemstone flexible in position while the fiber bundle end illuminates the gemstone in a fixed position. The gemstone is placed on a flat carrier or grabbed in a fife finger spreading spring holder both together are fixed in position.

Illumination and Light Guiding

The illumination and light guiding for a meaningful absorption spectrum in a high contrast is an important experimental part of the work. The light beam guiding through the gemstone must be good adjusted to get enough intrinsic absorption for the characteristic spectral curves vs. wavelength. Disturbed light as shine light, stray light and un-propagated light must be minimized to get best contrast and not saturation on the spectrometer detector unit. Therefore the size of the polished gemstone should be not too small and the proportion between width and height should be in a good relation. That means the relation between pavilion and crown angel should be high enough depends on the refractive index of the gemstone which grants internal total reflection.


If the gemstone lost propagation light by irregular transmission (out coupling) through pavilion facets (so named “windowing”) than could it be the measured light intensity has not the best condition for the absorption analysis.

Fig. 4, Fig. 5 and Fig. 6 show some ray trace sketches computed using the program GemCad [4]. The simulations show this behavior depend of the gemstone proportions and light lunching in different orientations of the gemstone facets.

Fig. 4a. Oval gemstone geometry

Light lunched from top into the table and crown facets and should be propagate intern along the long geometrical axis. The longer the internal light propagation the more characteristic absorption can be measured.

For this orientation the pavilion angle is too small for a refractive index of 1.8. Therefore most of light couples out after a short way. Only a small part of internal propagated light can be used for the measurement.

Fig. 4b. Oval gemstone geometry

Light lunched from top into the table and crown facets and should be propagate internal along the short geometrical axis.

In this orientation the property of the cut is good for internal total reflection by a refractive index of 1.8.

All lunched light couples out on the opposite side of the table and crown facets and can be used for the measurement.

Fig. 5a. Round gemstone geometry

Light lunched from top into the table and crown facets and should be propagate by internal total refection. In this case the pavilion angle is only 30° and therefore too small by a refractive index of 1.8. All lunched light couples out through the pavilion facets.

The gemstone shows windowing. Only some light take a longer internal way and may be could be analyzed.

Fig. 6. Round cut

Light lunched from top into the table and crown facets and propagate by internal total refection. In this case the pavilion angle is 42° and the refractive index is 1.8. All lunched light couples out at the table and crown facets. The gemstone shows no windowing.

All light take the longest internal way and can be analyzed.

The orientation in Fig. 6 is much more profitable to use because it is in-depend from the problems described in Fig. 4 and Fig. 5 a. The gemstone is placed upside down on a flat carrier. The lamp light is lunched into the pavilion facets and coupled out from the gemstone on the opposite side of the pavilion facets while the light inside is total reflected at the table facet. Therefor this method is used for all facetted gemstones measured in this report.

Experimental Results

In Tables of the appendix grouped according to the type of gemstone series of different colored gemstones are spectral analyzed. The spectral white lamp light is random polarized and not specific coupled into a defined crystal axis of the gemstones. Therefore the resulted spectral absorption curves in the appendix can’t discuss for axis orientated polarization states. All plots are contrast optimized by offset subtraction and normalization of the highest absorption peak within the VIS range. Therefor the visibility a) for small absorption lines and b) for low absorption in nearly colorless or high transparent gemstones (see Petalite, Appendix 12.7, Table 1) can be improved. Also the spectral color bars which are additionally placed below the spectral absorption curves become better visibility about absorption lines and weakly wide absorption bands. The spectral diagrams and color bars vs. wavelength are generated by the software Spectragryph [3].

The visibility of absorption peaks and bands for the measured gemstones are sometimes controlled with a hand held ocular spectrometer from OPL [5].

The spectral curves in the appendix are the results of serial measured gemstones. The plots show characteristic small peaks and/or wide band absorption versus wavelength over the VIS range. The different absorptions vs. wavelengths are understand as typically for different single or groups of gemstones like Diamond, Corundum, Beryllium, Chrysoberyl, Spinel, Topaz, Garnet, Zircon and Tourmaline and a last wide group of rare gemstones, mainly classified by the ranking of hardness. The measured absorption spectral plots can be compared on one hand with reference books [6, 7]. On the other hand they can be compared with spectral line plots which are online presented in the internet [9, 10 and 11].

Reference [6] describes a lot of gemstones in her physical parameters which used for jewelries and/or for a gemstone collection. A table with main and incidental absorption lines for many gemstones is presented. Additionally some colored spectral plots of important gemstones are shown. Reference [9] presents in many more tables measured color spectral bars of special gemstones sorted by colors. Comments for each measured spectral bars are given. Both references give also information about the reason of the characteristic color of the gemstones. Often the color is activated by the free electron transitions or the electron interactions charge transfer (IVCT) with guest metallic ions which are in tiny trace deviations in defect positions of the host crystal matrix. These transition elements mainly could be Titanium, Vanadium, Chromium, Manganese, Iron, Cobalt, Nickel and Copper as pure ore in mix of ions [11]. Depend on the intensity of the color the spectral analysis shows more or less separately characteristic absorption versus the wavelength.

Conclusion and Outlook

Spectral absorption measurements at gemstones with the SMA-E Spectrometer from Thunder Optics [2] are presented in this report. The results are graphed in spectral curves vs. wavelength and furthermore in colored spectral bars for each measurement. For data processing and documentation the extensive and powerful software Spectragryph [3] is used. The measurement system and the measurement light guiding are discussed in details. The Appendix 1-12 contains arranged in tables all spectral diagrams from the measured gemstones.

In the future more measurements should be added in the appendix. Furser measurements should be directed on polarization depend spectral analysis if the gemstone has a significant birefringence. Also gemstones with color change effects (key word pleochroism) should be again characterized.

Appendix Overview Table

References

[1] Mineral Atlas, Specific physical parameter for Zircon, mineralienatlas.de.

[2] Thunder Optics, Technical data sheet for the SMA-E Spectrometer, thunderoptics.fr

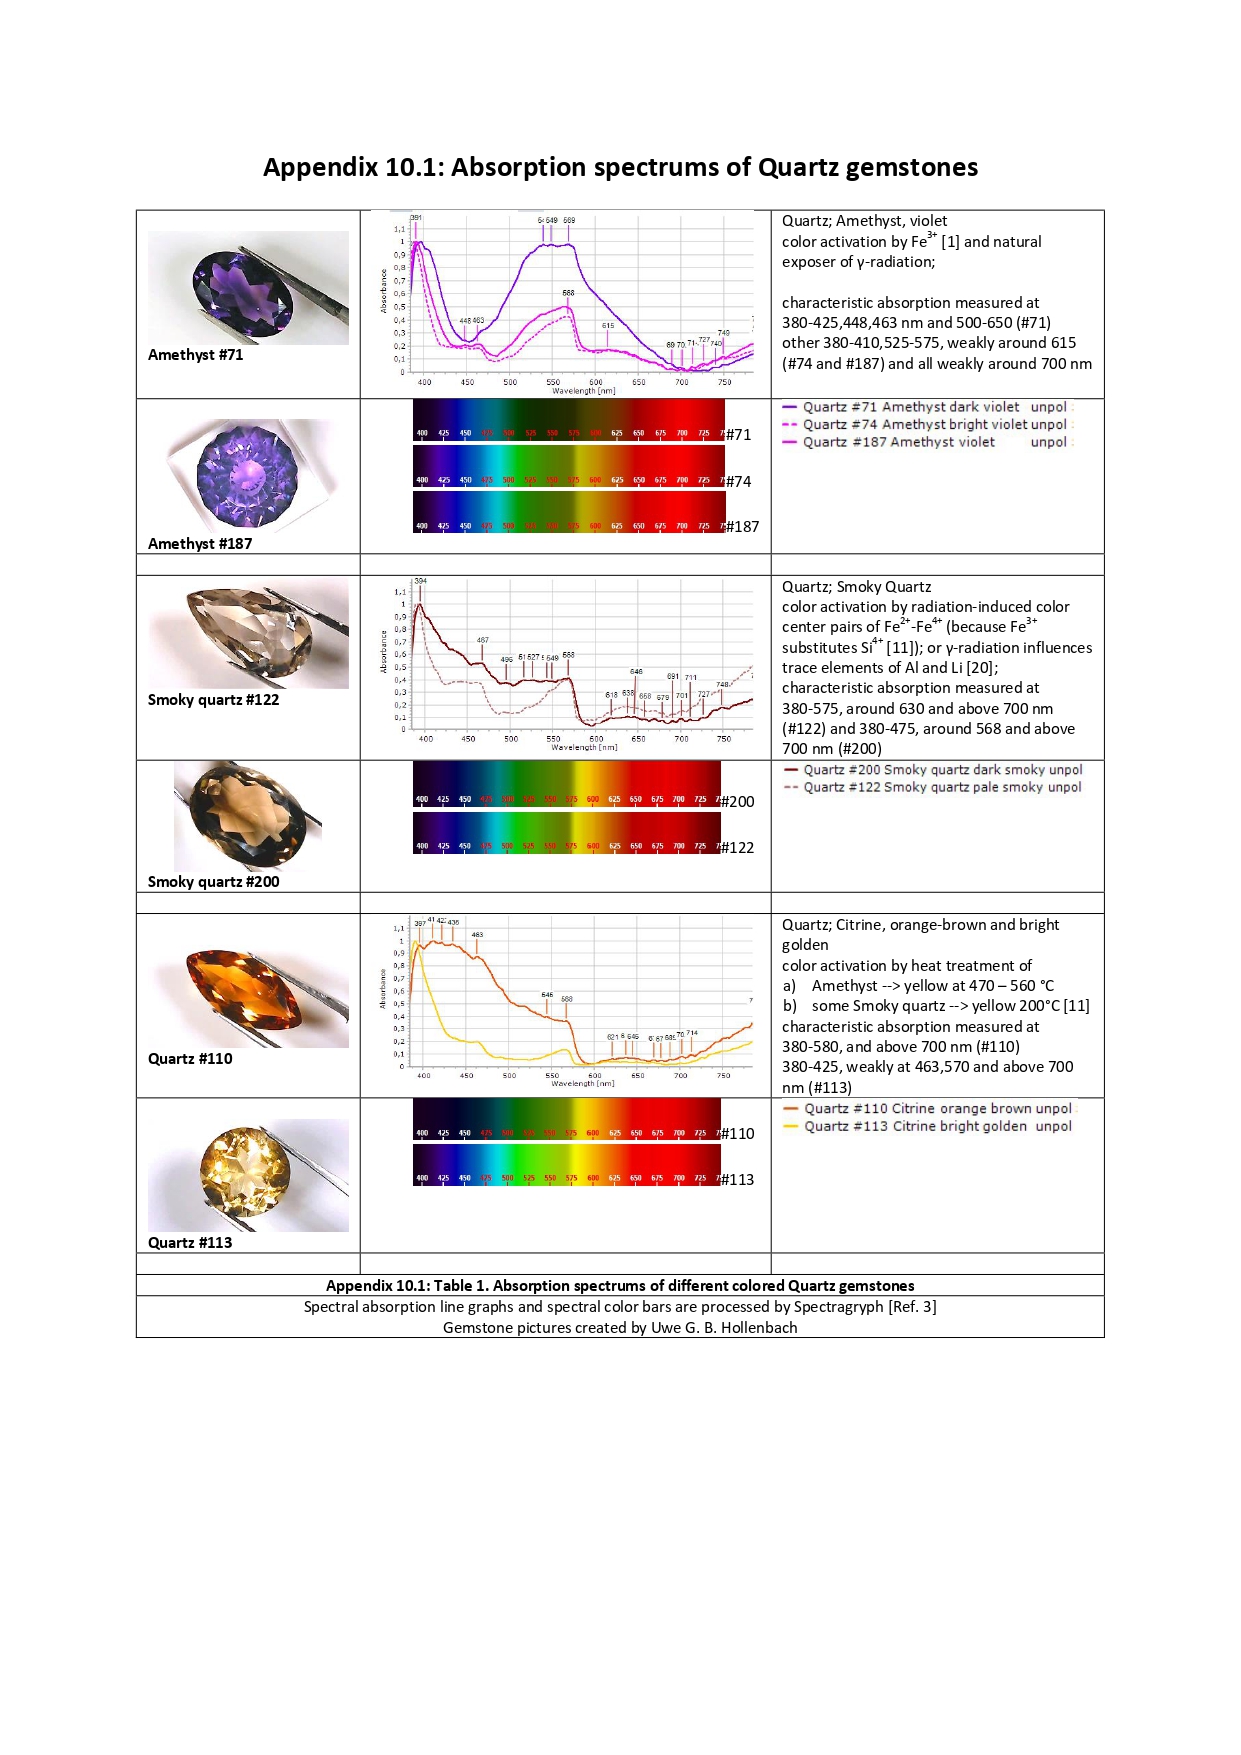
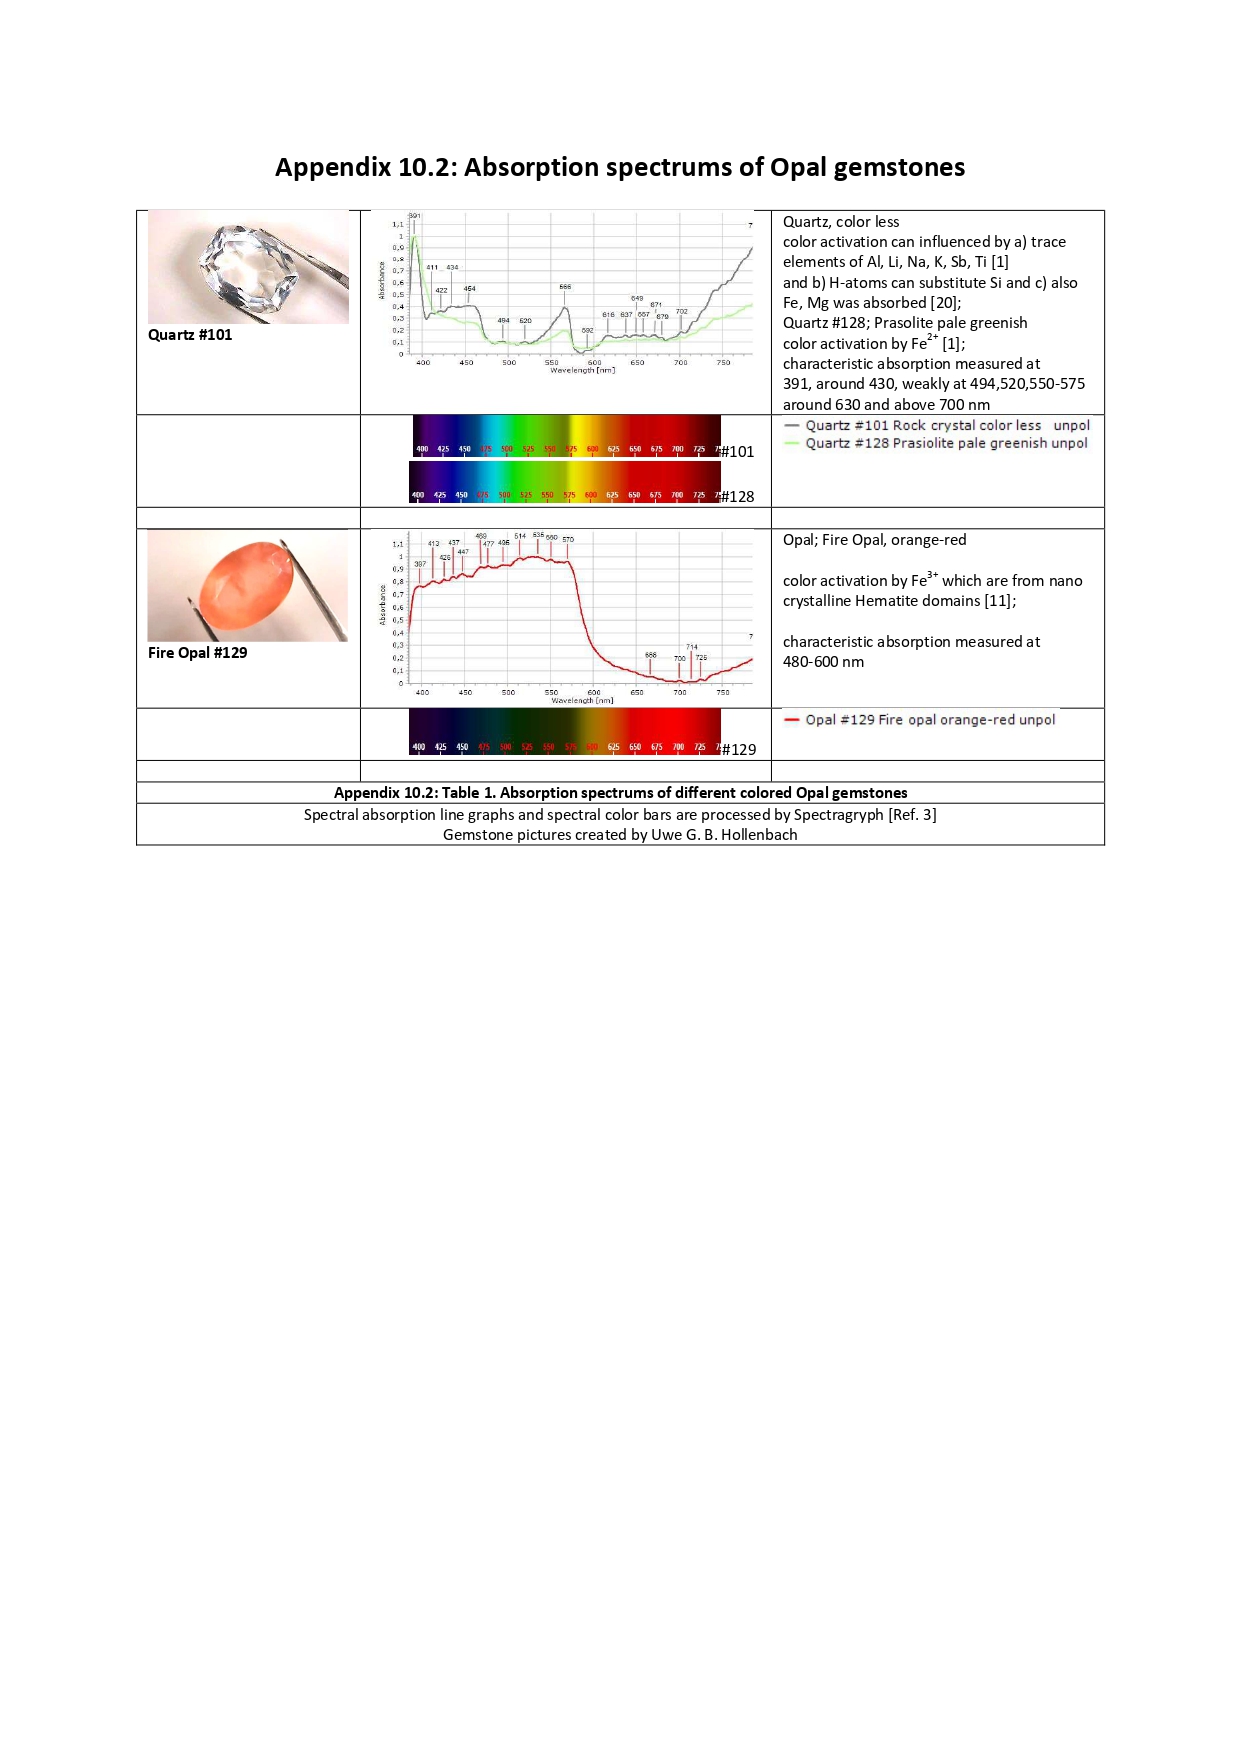
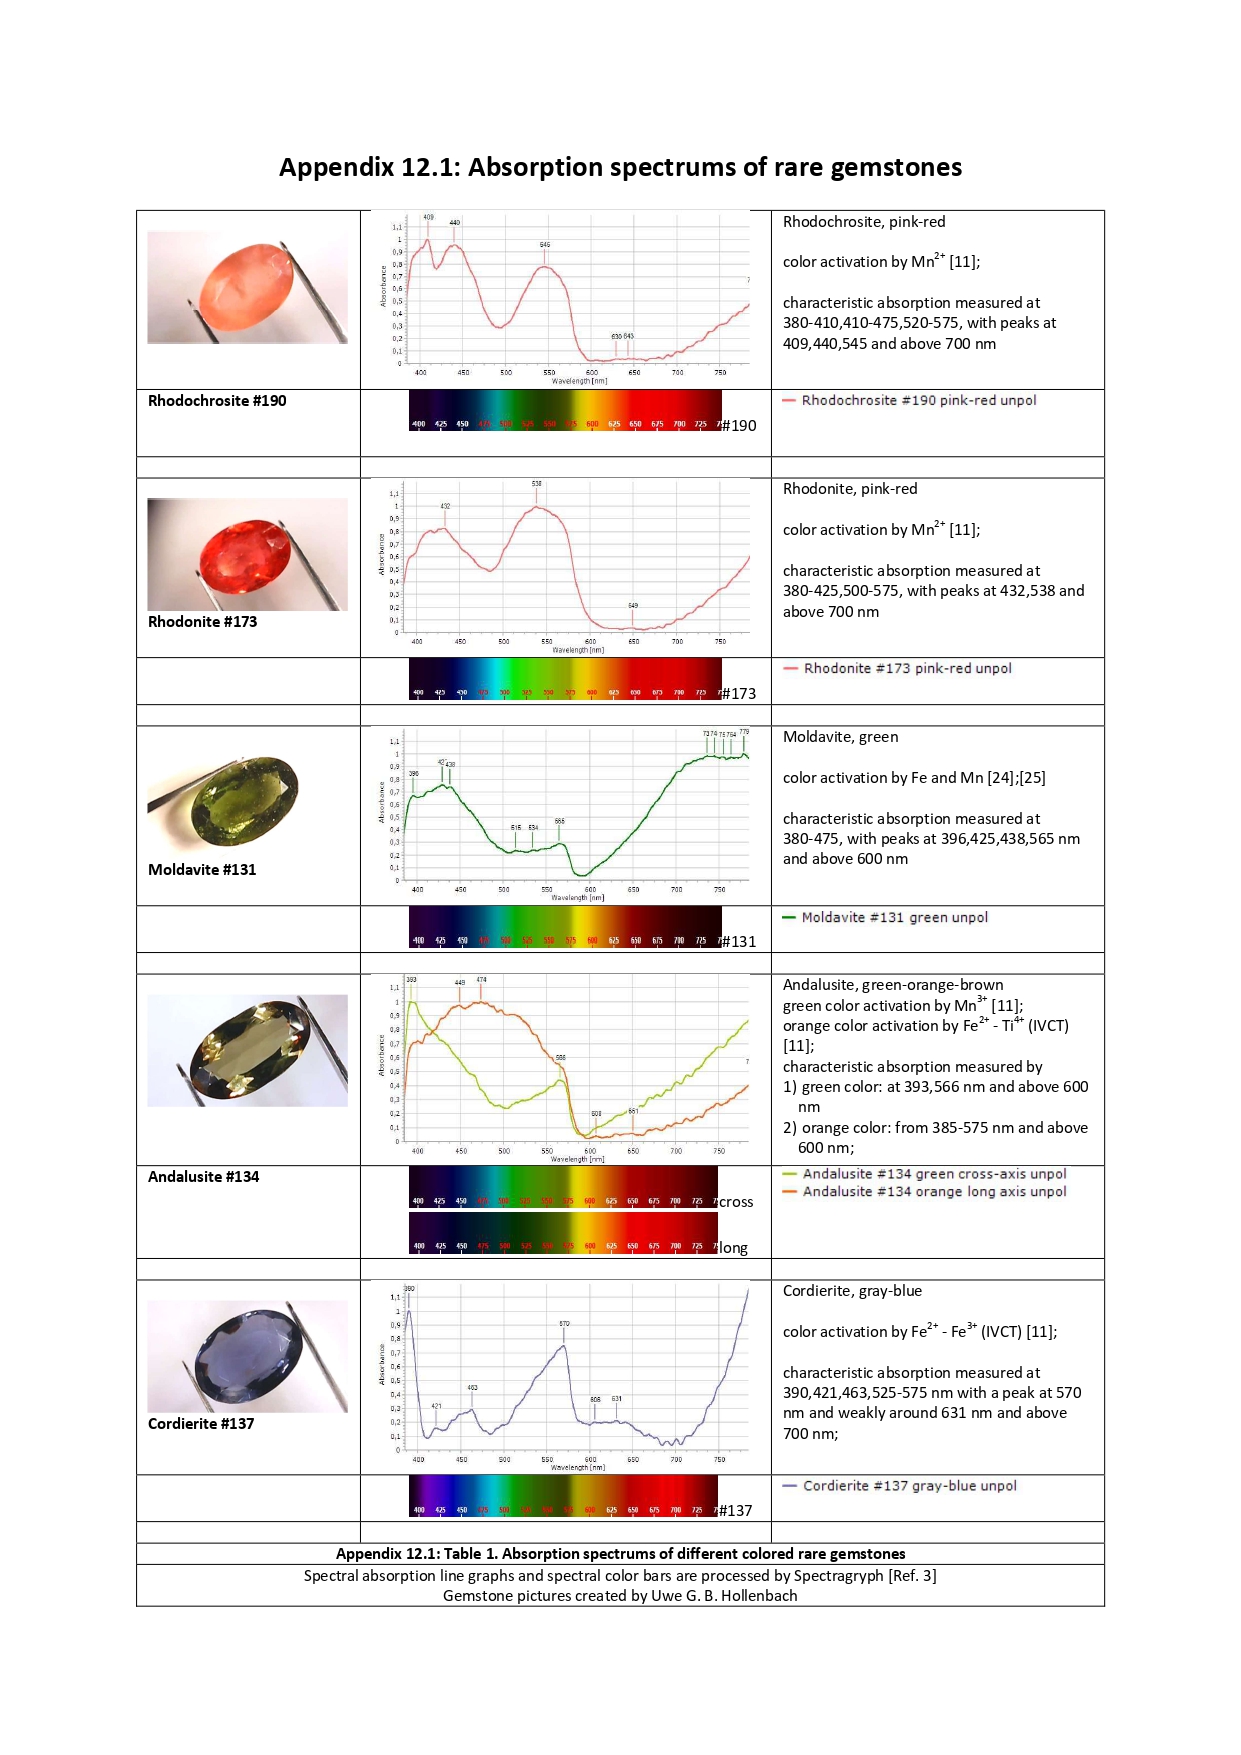
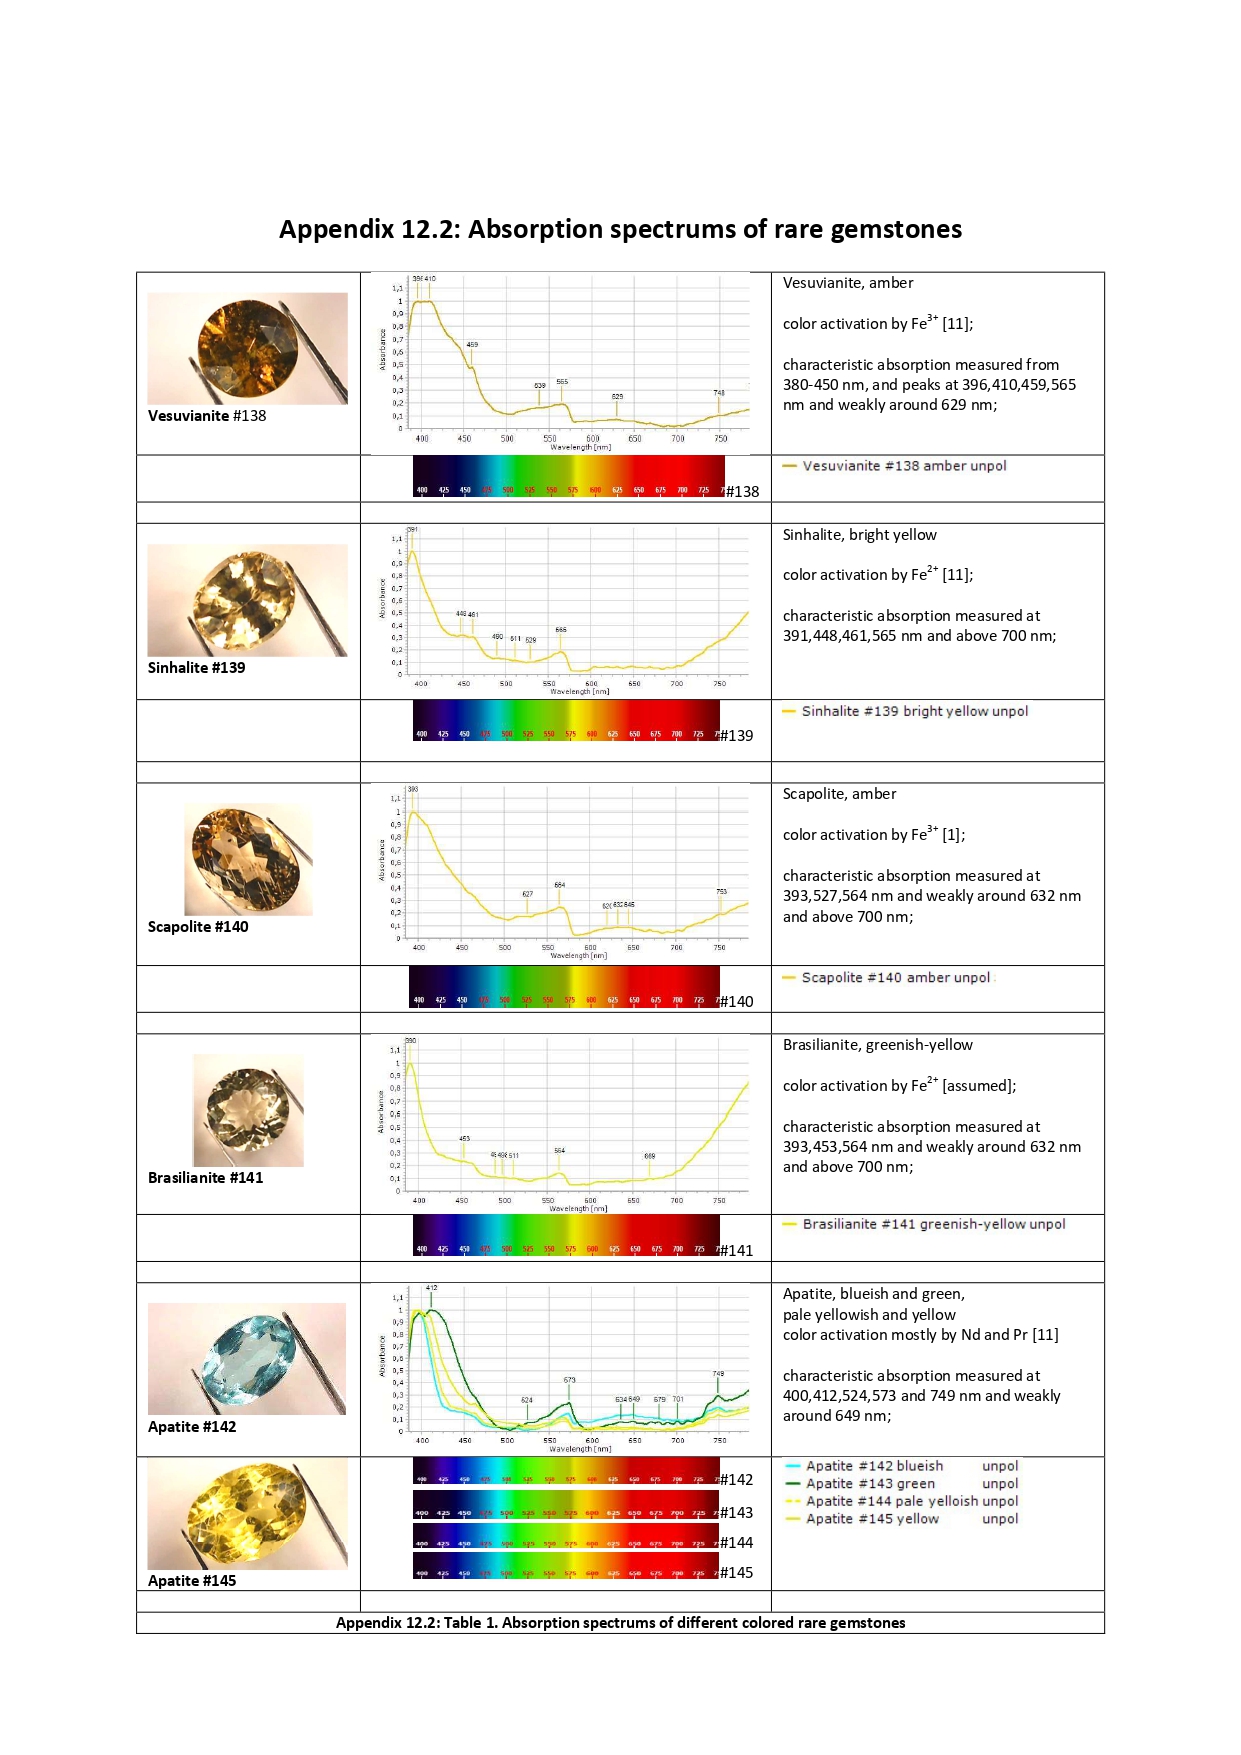
[3] SpectraGryph; Optical spectroscopy software; effemm2.de/spectragryph

[4] GemCad, Gemstone cut design software and ray tracing simulation, gemcad.com

[5] Orwin Product , OPL ocular hand spectrometer, www.oplspectra.com

[6] Walter Schumann, “Edelsteine und Schmucksteine”, 15th edition, ISBN 978-3-8354-0715-2.

[7] Birgit Günther, “Tables of Gemstone Identification”, 2nd edition, ISBN 3-9800292-3-9.

[8] Eduard Gübelin, “Edelsteine”, p 104, ISBN 3-88102-010-1.

[9] Absorption spectra database Gemlab UK; gemlab.co.uk

[10] Spectroscopy for Gemologists; spec4gem.info/databases/UV-Vis-NIR

[11] California Institute of Technology Pasadena, California, USA, List of Visible Data Files on the Caltech Mineral Spectroscopy Server, http://minerals.gps.caltech.edu/FILES/Visible/Index.html

[12] Huang RR, Yin ZW. [Spectroscopy Identification of Untreated and Heated Corundum]. Guang Pu Xue Yu Guang Pu Fen Xi. 2017 Jan;37(1):80-4. PMID: 30192484.

[13] Chen T, Yang MX. [Gemology characterization and identification of beryllium diffused, heated and untreated bicolor sapphires from Changle City, China]. Guang Pu Xue Yu Guang Pu Fen 2012 Mar;32(3):651-4. Chinese. PMID: 22582625.

[14] Kyungjin K, Yongkil A. Color Enhancement by Diffusion of Beryllium in Dark Blue Sapphire. Guang Pu Xue Yu Guang Pu Fen Xi. 2016 May;36(5):1623-8. PMID:30001073.

[15] Chen T, Liu YG, Yin ZW, Liu N. [Gemology and spectra characterization of gem garnet from Muling City, Heilongjiang Province]. Guang Pu Xue Yu Guang Pu Fen 2013 Nov;33(11):2964-7. Chinese. PMID: 24555361.

[16] Pluthametwisute T, Wanthanachaisaeng B, Saiyasombat C, Sutthirat C., “Cause of Color Modification in Tanzanite after Heat Treatment”. 2020 Aug 16;25(16):3743. doi: 10.3390/molecules25163743. PMID: 32824379; PMCID: PMC7465713.

[17] IGR, Italian Gemological Review, https://rivistaitalianadigemmologia.com/en_GB/2017/09/12/la-spettroscopia-uv-vis-nir-in- gemmologia/

[18] Mao J, Chai LT, Guo SG, Fan JL, Bao F. “Spectra of dark green jade from Myanmar”. Guang Pu Xue Yu Guang Pu Fen Xi. 2013 May;33(5):1388-91. PMID: 23905358.

[19] Nikbakht T, Kakuee O, Lamehi-Rachti M., “An efficient ionoluminescence analysis of turquoise gemstone as a weakly luminescent mineral”. Spectrochim Acta A Mol Biomol Spectrosc. 2017 May 15;179:171-177. doi: 10.1016/j.saa.2017.02.038. Epub 2017 Feb 21. PMID: 28242446.

[20] Rykart R, “Bergkristall”, p 19,38, Ott Verlag Thun, 2nd edition 1977.

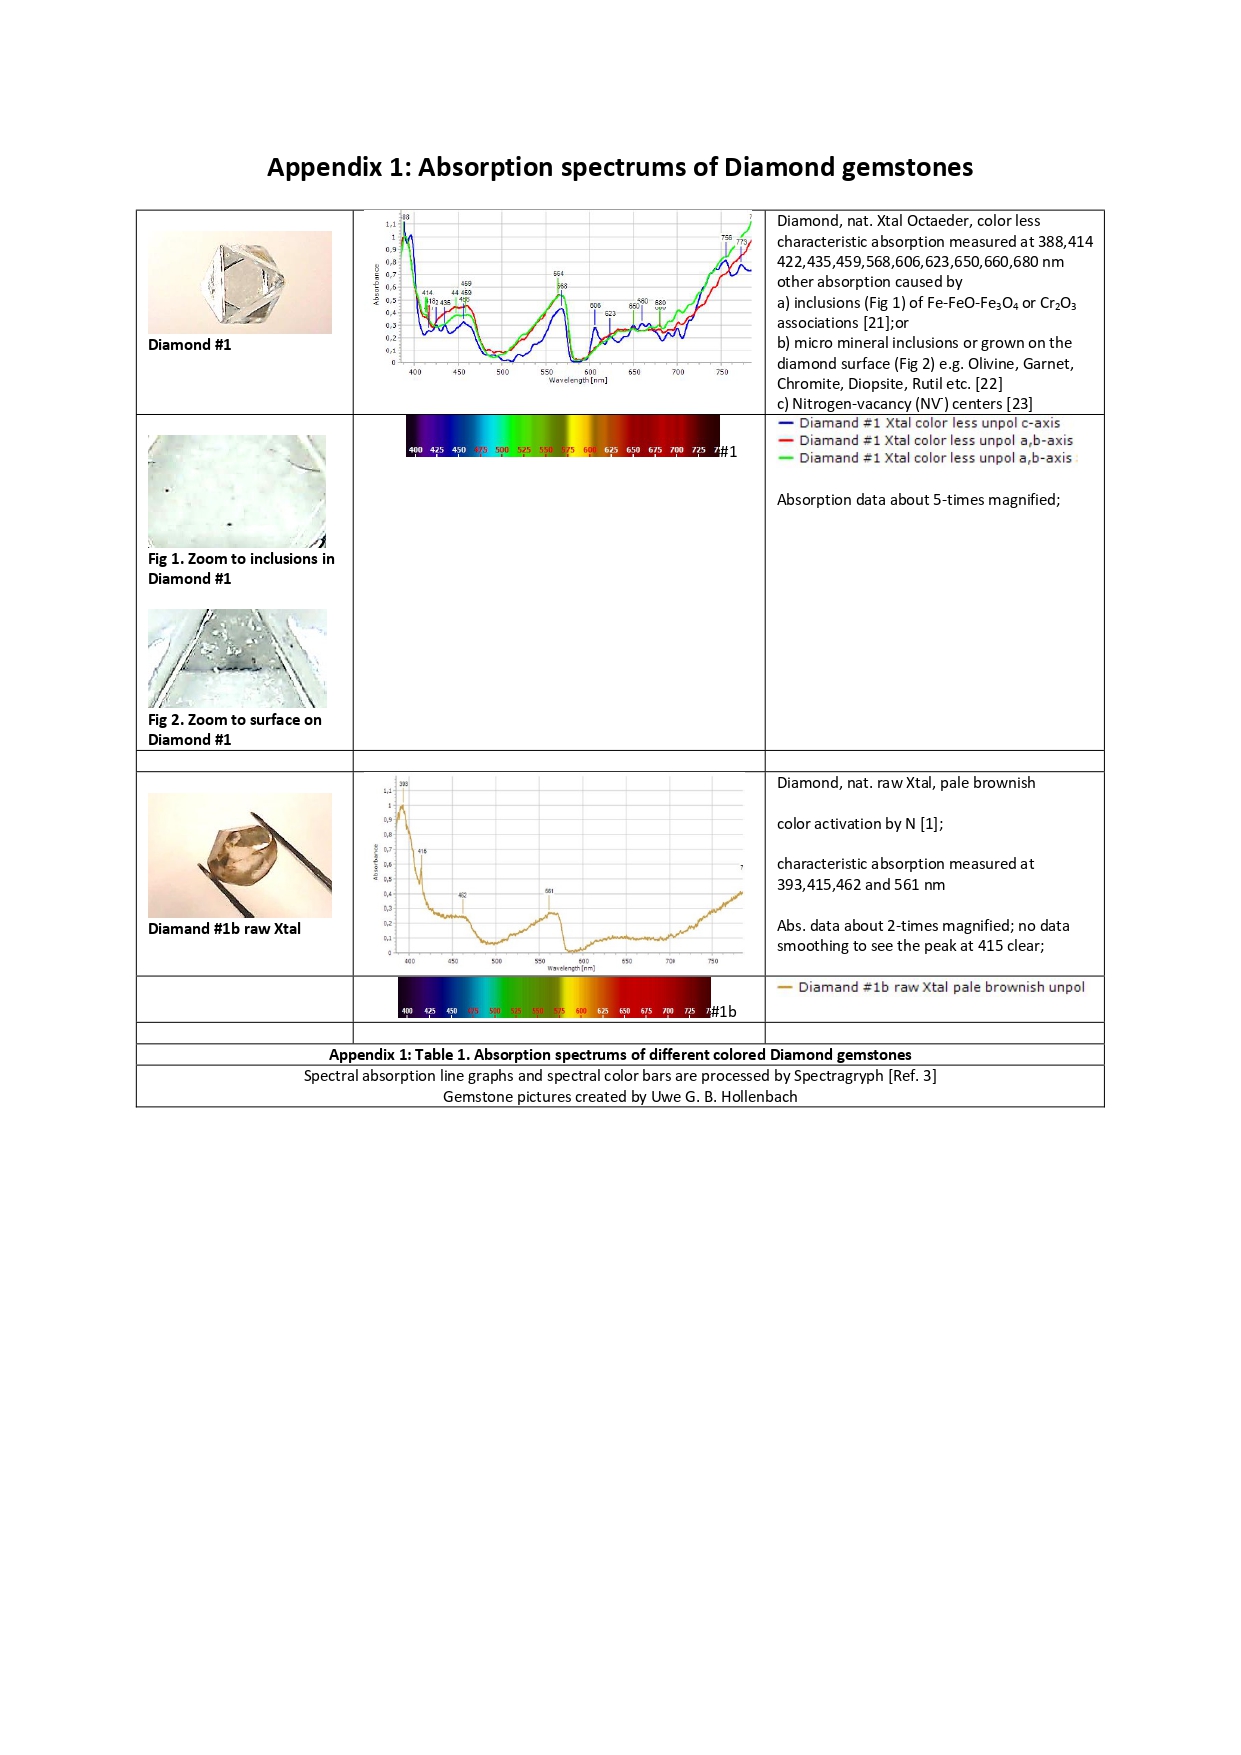
[21] Stachel, T., Harris, J. & Brey, G., “Rare and unusual mineral inclusions in diamonds from Mwadui, Tanzania”, Contrib Mineral Petrol 132, 34–47 (1998). https://doi.org/10.1007/s004100050403

[22] Legrand J, other. , “Der Diamant”, produced by VNU Books International, Karl Müller Verlag 1991.

[23] Subedi Shova D., “Laser spectroscopic characterization of negatively charged nitrogen-vacancy (NV−) centers in diamond”, Optical Materials Express 2076, Vol. 9, No. 5 ,1 May 2019.

[24] GIA https://gia.edu/gems-gemology/spring-2015-gemnews-moldavites-natural-fake

[25] Tay Thye Sun1, Wilawan Atichat2, Boontawee Sriprasert2,3, Thanong Leelawatanasuk2, “Moldavite: Natural or Imitation”.

1Far East Gemological Laboratory, 400 Orchard Road #03-10, Singapore, 238875; email: fegemlab@singney.com.sg

2The Gem and Jewelry Institute of Thailand (Public Organization), Bangkok 10330, Thailand.

3The Department of Mineral Resources, Bangkok 10400, Thailand.

About the Author

Uwe G. B. Hollenbach reached his degree of Diploma in Physic in the year 1985 from University of Paderborn, Germany. 1985 he starts his career as scientist with Carl Zeiss Foundation in the field of wave optics. From 1987 to 2000 he was with IOT – Integrated Optic Technology

– a spin-off from Carl Zeiss and Schott – leader of the optical measurement group within the development division in the field of integrated single mode waveguide components based on glass for fiber optical networks. From 2000 to 2017 he was with KIT – Karlsruhe Institute of Technology at IMT – Institute for Microstructure Technology and works in the field of micro optical sensor systems based on polymer formed by LIGA technique. The last ten years with KIT/IMT he was within the micro optical division leader of the micro optical components group. The focus of this development was the demonstration of components of integrated optical single mode waveguide produced by polymer diffusion technique and single mode waveguide structuring by laser direct writing for printed electronic board integration. From 2018 until today the author is retired and now dedicates himself to his hobby in the field of gemology and mineralogy.

Uwe G. B. Hollenbach

TOKL #T21001
Germany

02/05/2021